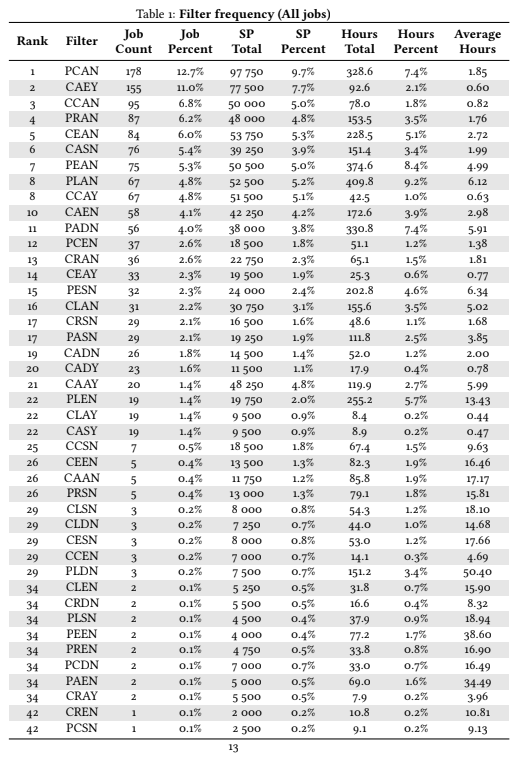
Summer 2024 Job Distribution
As we have mentioned throughout a couple of our posts, we at BNG use Monte Carlo Simulation (MCS) in order to test out the performance of different dispatch strategies. To run such a simulation, we need to know the statistical distribution of the union jobs. We need to know the type of distribution and we need to know its parameters.
There is no mystery regarding the first component - it is a discrete statistical distribution. There is a finite number of possible jobs that may be generated. A discrete distribution is specified by two pieces of information: a list of possible outcomes, and each outcomes probability of occurring.
Given the mechanisms of the game, we know all the types of jobs that could be implemented. A job filter is determined by four variables:
- Region: Current (C) or Previous (R)
- Rarity: Legendary (L), Epic (E), Rare (R), Common (C) or Any (A)
- Fuel: Steam (S), Diesel (D), Electric (E) or Any (A)
- Union-badged: Yes (Y) or No (N)
Multiplying the number of possible values for each variable, we get 80 filters (= 2 × 5 × 4 × 2). However, for whatever reasons, the game developers does at the time of writing not allow for union-badged jobs in your prior region (PXXY). That’s 20 jobs out of the window. The game developers does not allow for quadruple locked jobs. The least possible restricted job is either a PAAN or CAAN. These are single locked jobs. Only the region is restricted. A double locked job requires a specific, and a specific level of rarity, fuel or union-badged trains (only one of these last three). As such, no current region, union-badged train job with both a specific level of rarity and specific fuel type may occur. That’s 12 jobs that simply does not occur: CLSY, CLDY, CLEY, CESY, CEDY, CEEY, CRSY, CRDY, CREY, CCSY, CCDY, CCEY. The total number of jobs possible has consequently been brought down to 48. However, for as long as we at BNG have been tracking the job data, only 45 filters are ever observed each season. Interestingly, the three missing job filters differ from season to season.
Alright, so there are 45 possible values, what is the probability of each? Thanks to our Operation Blackbox (read more about it here), we have a pretty good idea. Being half-way through the season, we have observed over 1 400 jobs! So there you go, the statistical distribution of the union jobs.

